Western Australian Tool for Circular Horizons
Monitoring the contributions of circularity towards achieving Net Zero
Project background
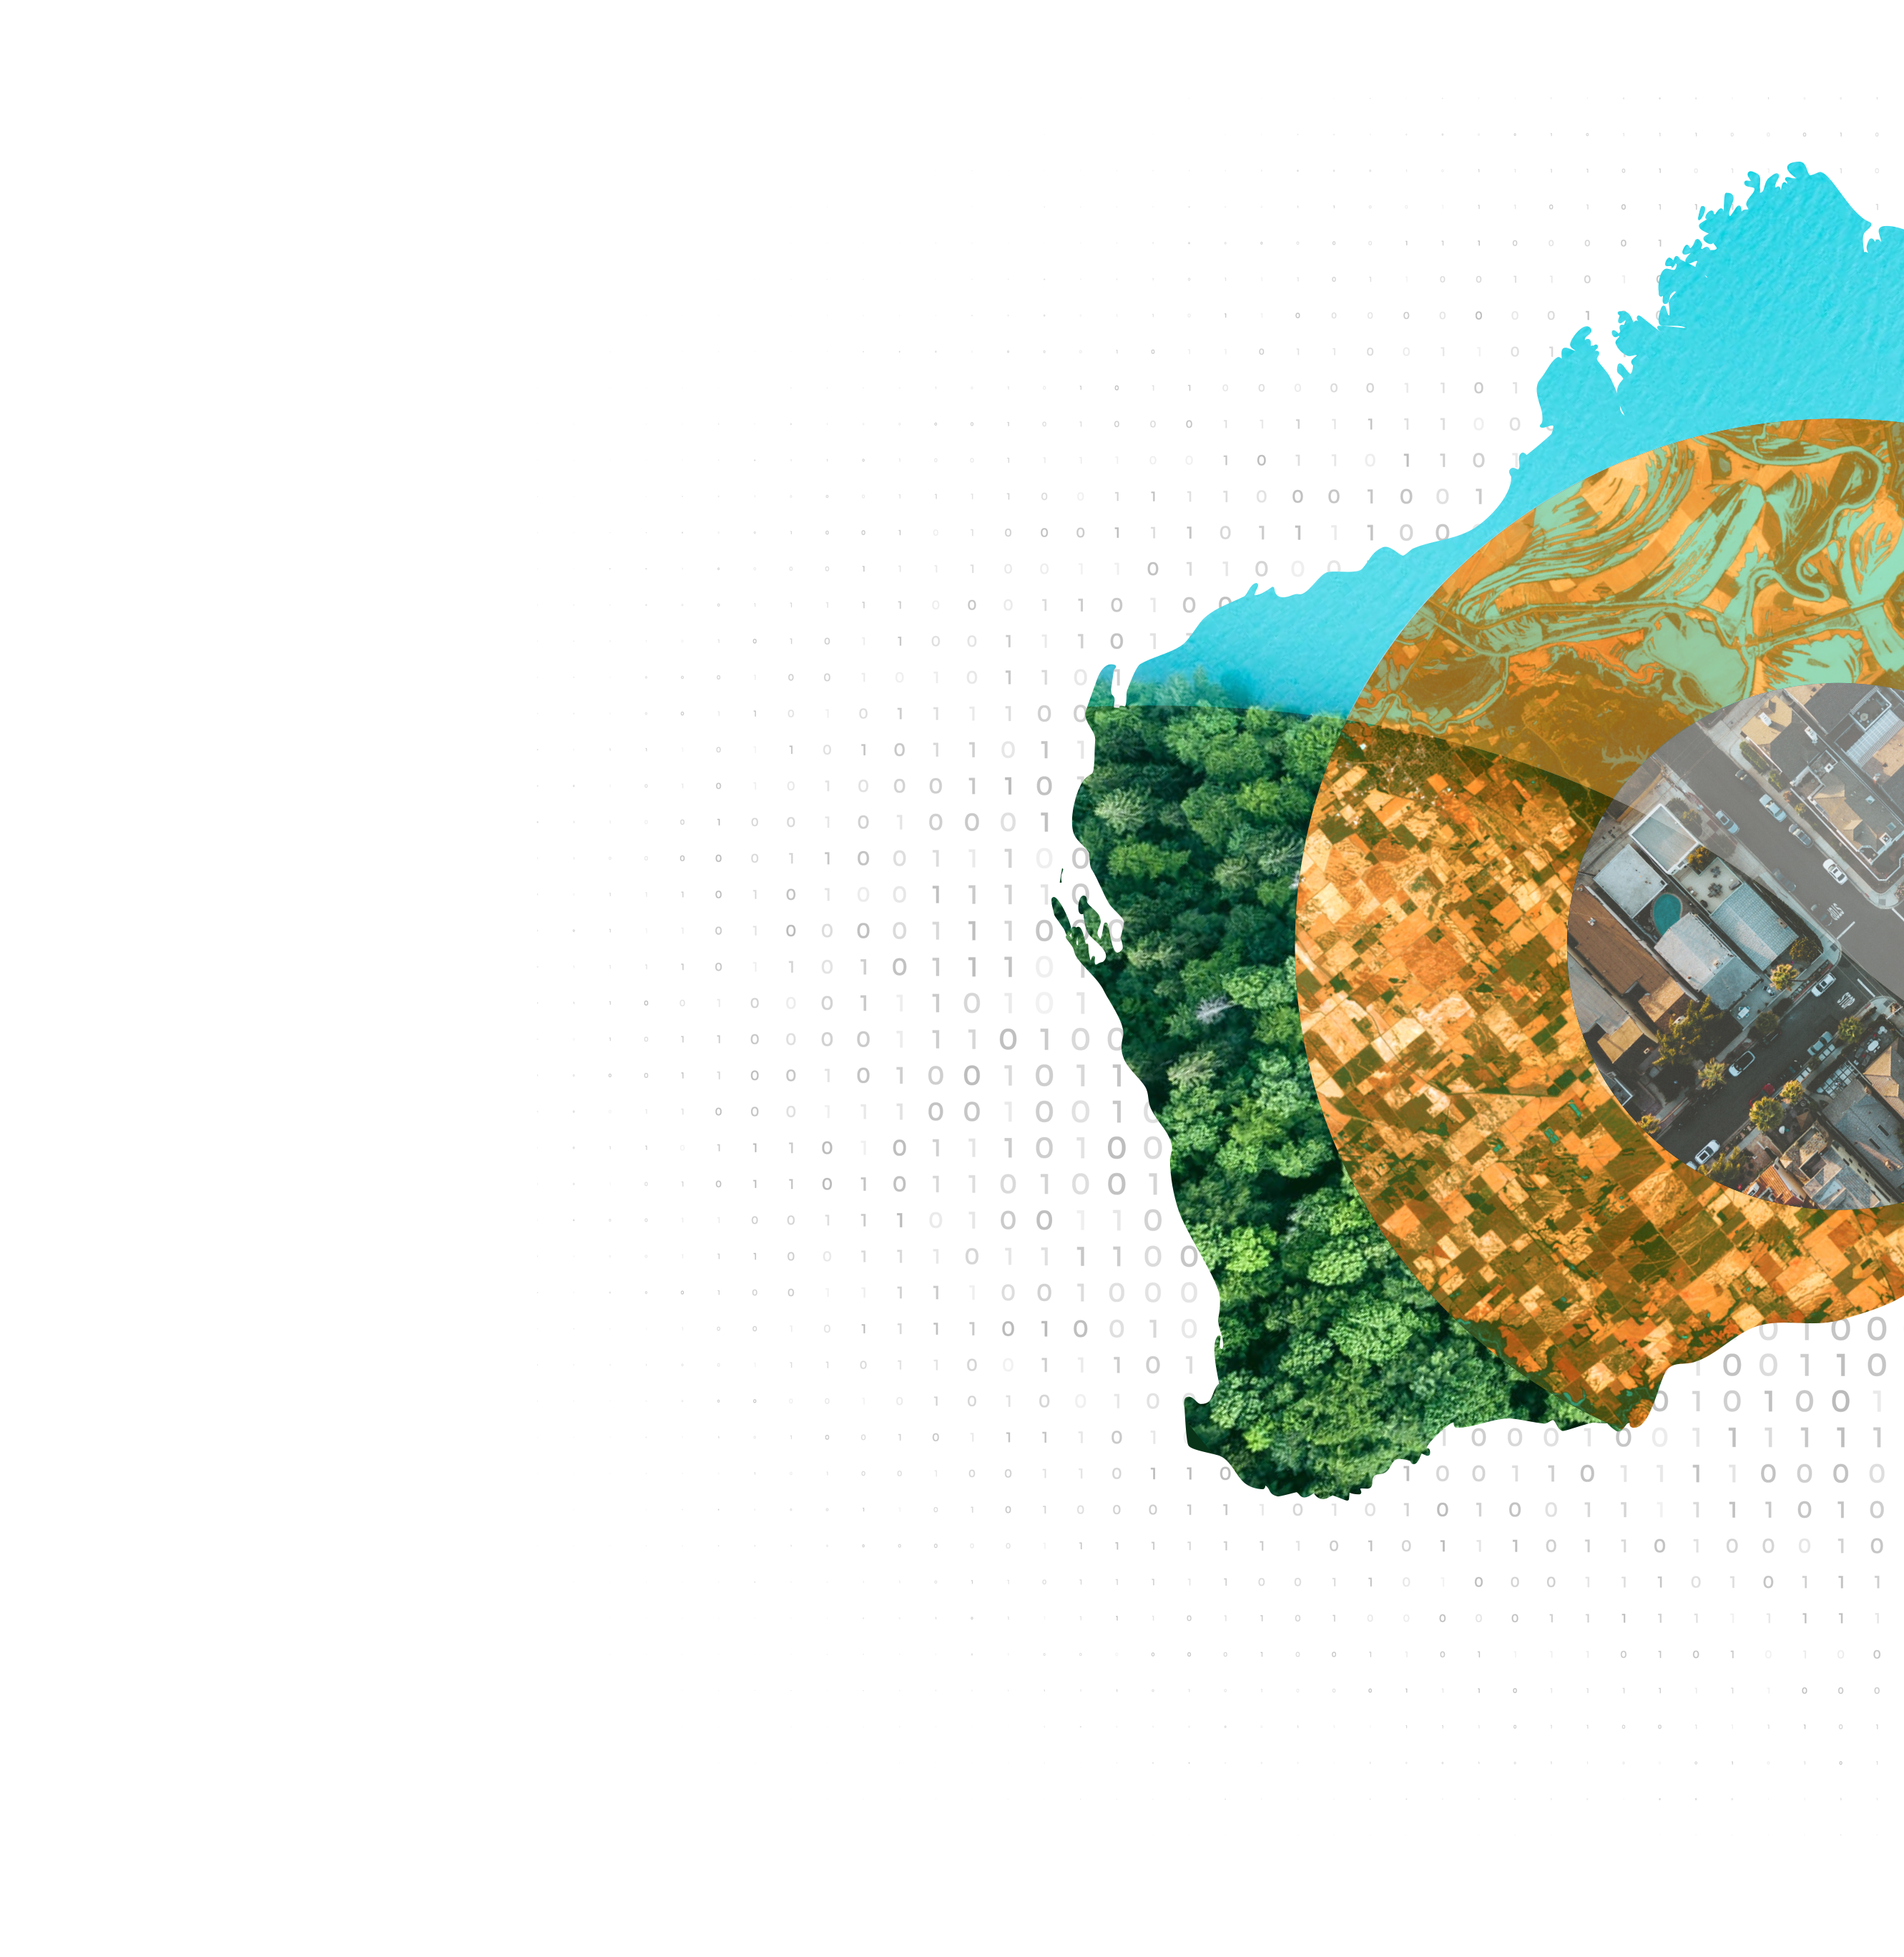
Over 75% of natural resources are allocated and consumed in cities, where over 70% of global waste production is also generated (Zaman and Lehmann, 2013 ). With approximately half of the GHG emissions associated with material handling and use (IRP, 2019 ), there is a clear need to transform linear value chains and preserve material value to achieve Net Zero at the city scale (UNEP, 2021 ).
Circular economy strategies are becoming increasingly more popular in mitigating waste production and helping to maintain materials and resources in use, effectively reducing the need to extract virgin materials in production processes (Kirchherr et al., 2017 ). This equally applies to resources, such as concrete, metals, glass, electronics, plastics, fossil fuels, and biomass at an industry and household level.
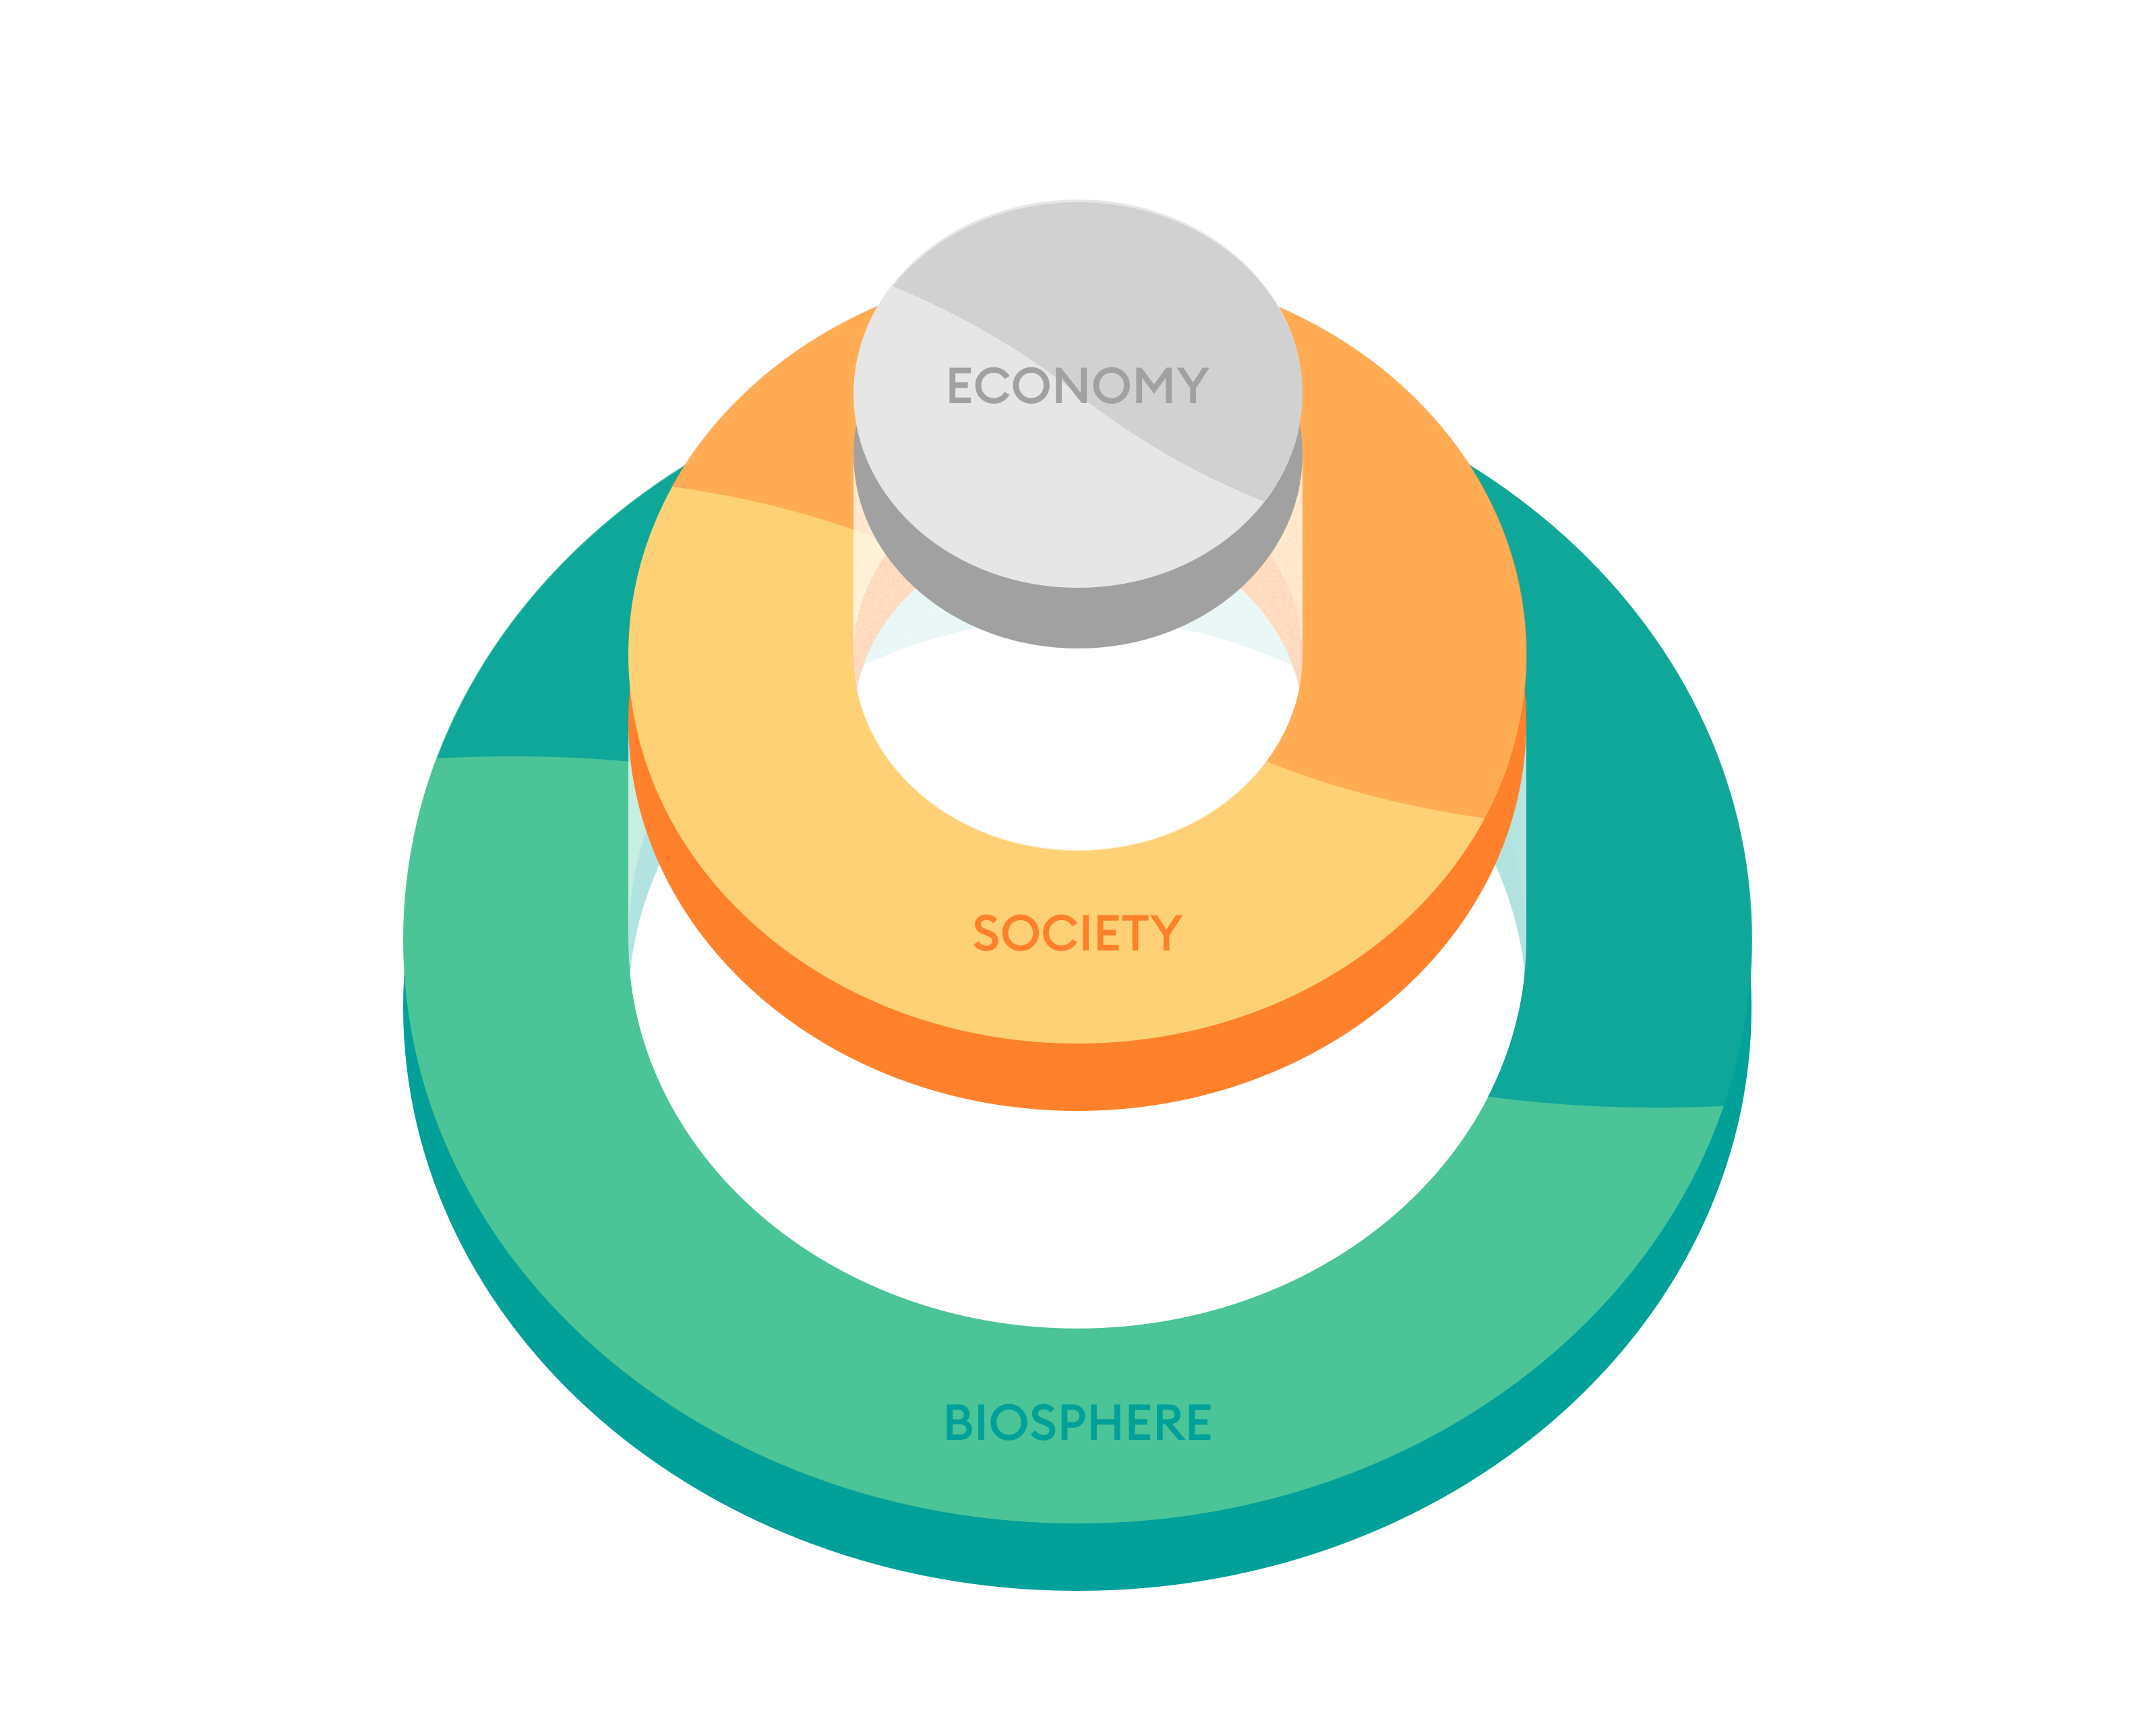
Problematically, however, creating closed material loops at a product or industry level alone does not ensure environmental sustainability (Harris et al., 2021 ), highlighting the importance of a systems-wide approach at a city or regional level that goes beyond waste management strategies (Schandl et al., 2020 ). Such an approach must monitor and integrate indicators with a clear understanding of the circularity mechanism concerning economic activity and environmental performance (Lieder and Rashid, 2016; Pauliuk, 2018 ).
Together with Local and Regional Councils, State departments, and industry partners, this project will further enhance our understanding of circularity in Western Australia (WA) with the ultimate aim of providing a key performance indicator framework within a digital circular monitor (suggested working title: Western Australian Tool for Circular Horizons – WATCH) for effectively monitoring and driving circular outcomes.
Such comprehensive tools are critical in understanding urban metabolism and supporting cross-sector collaboration towards enhanced resource efficiency and environmental performance. These innovative tools and processes will provide governments, industry, communities, and any interested stakeholders with the conceptual and empirical backbone to support circular planning and decision-making related to waste minimisation and effective circular applications within WA (D’amato and Korhonen, 2021 ). This project will position WA as a global leader in integrating circular economic and Net Zero approaches within a digital monitoring framework.
The purpose of the longer-term project is to map and monitor the flow of materials from extraction to end-of-use and support the identification of key opportunities towards greater circularity and Net Zero emissions for WA cities. The research will create tangible methods and tools for WA cities to measure, monitor and report on enhanced material flows (including narrowing, slowing, cycling, and regenerating) and assess progress towards decoupling raw material use and environmental impacts from economic activity and societal needs.
Through local and state government demonstrations, the project will inform resource strategies (including enhanced resource efficiency, closing supply chains, product lifetime extension, and residual waste management) and enable scale-up plans at the city and regional scale.
Challenges
- 75% of natural resources are allocated and consumed in cities1
- 70% of global waste production occurs in cities2
- Construction and demolition represents 50% of waste in Perth3
- 50% of GHG emissions are associated with material handling and use4
- Going beyond waste management strategies5
- Need for a multi-scale and system-wide approach6
- Access to a rigorous monitoring and indicator framework7
- Effectively driving circular and Net Zero outcomes8
Opportunities
- Circularity as a key enabler to achieving Net Zero9
- Economic diversification and innovation as drivers of job growth and resource efficiency gains10 11
- Preserving the value of products and materials, while designing out waste and pollution12
- Effectively monitoring and driving circular outcomes across multiple levels and sectors13
- Aligning investment and procurement with circular strategies
- Guiding policy development with evidence-based insights
- Positioning Western Australia as a global leader
Project goals
- Map and monitor the flow of materials from extraction to end-of-use
- Create tangible methods and tools for governments, industry, communities to measure circularity
- Identify key opportunities towards greater circularity and Net Zero emissions
- Support cross-sector collaboration towards enhanced resource efficiency and environmental performance
- Support circular planning related to waste minimisation and effective circular applications
- Provide case studies
- Inform policy ambition
- Enable scale-up plans at the city and regional scale
Stage 1: Mapping the Circular Economy of WA
- To determine the state of play in circular economy systems research and policy internationally and locally.
- To quantify and visualise the resource inflow and waste outflow linked to final consumption within Greater Perth and the related energy use and greenhouse gas (GHG) emissions.
- To estimate, map and visualise the material stocks and flows within the administrative boundaries of Greater Perth
- To recommend further stages and dissemination.
Contextualising approach
This initial task aims to contextualise the proposed methodological approach within the international, national and local context and includes the following activities:
- Review the international literature.
- Review and map WA policies and relevant initiatives, commitments, indicators and targets which the project can effectively support. This will help guide future indicator development and ensure project outputs are relevant and useful for policymakers and stakeholders.
- Data stocktake to assess the feasibility of the approach in relation to currently available data in WA, as well as to identify potential challenges and limitations that need to be addressed.
- Finall, a presentation to key stakeholders will contextualise the Stage 1 approach within a wider circular economy monitoring framework. The presentation will be key to building additional capacity for the long-term vision by clearly communicating the projects benefits, gaining stakeholder support, and ensuring that the wider research effort is relevant, feasible, and aligned with existing initiatives and policies.
Measuring the footprint
The next major work package will quantify the material (minerals, ores, biomass, fuels, and water) inflows and waste outflows – the material footprints – of Greater Perth. Environmentally-Extended Input-Output Analysis (EE-IOA), together with local activity and waste data, will be utilised to quantify the life-cycle of products and services and the associated material flows.
• Activity 3.2: Account for embodied environmental flows (e.g., energy use and GHG emissions) generated along the supply chain during the production of all goods and services consumed. This builds on methods from activity 3.1 and considers the consumption and investment activity of governments (e.g., procurement, subsidisation) and households, and the total supply required to meet final demand.
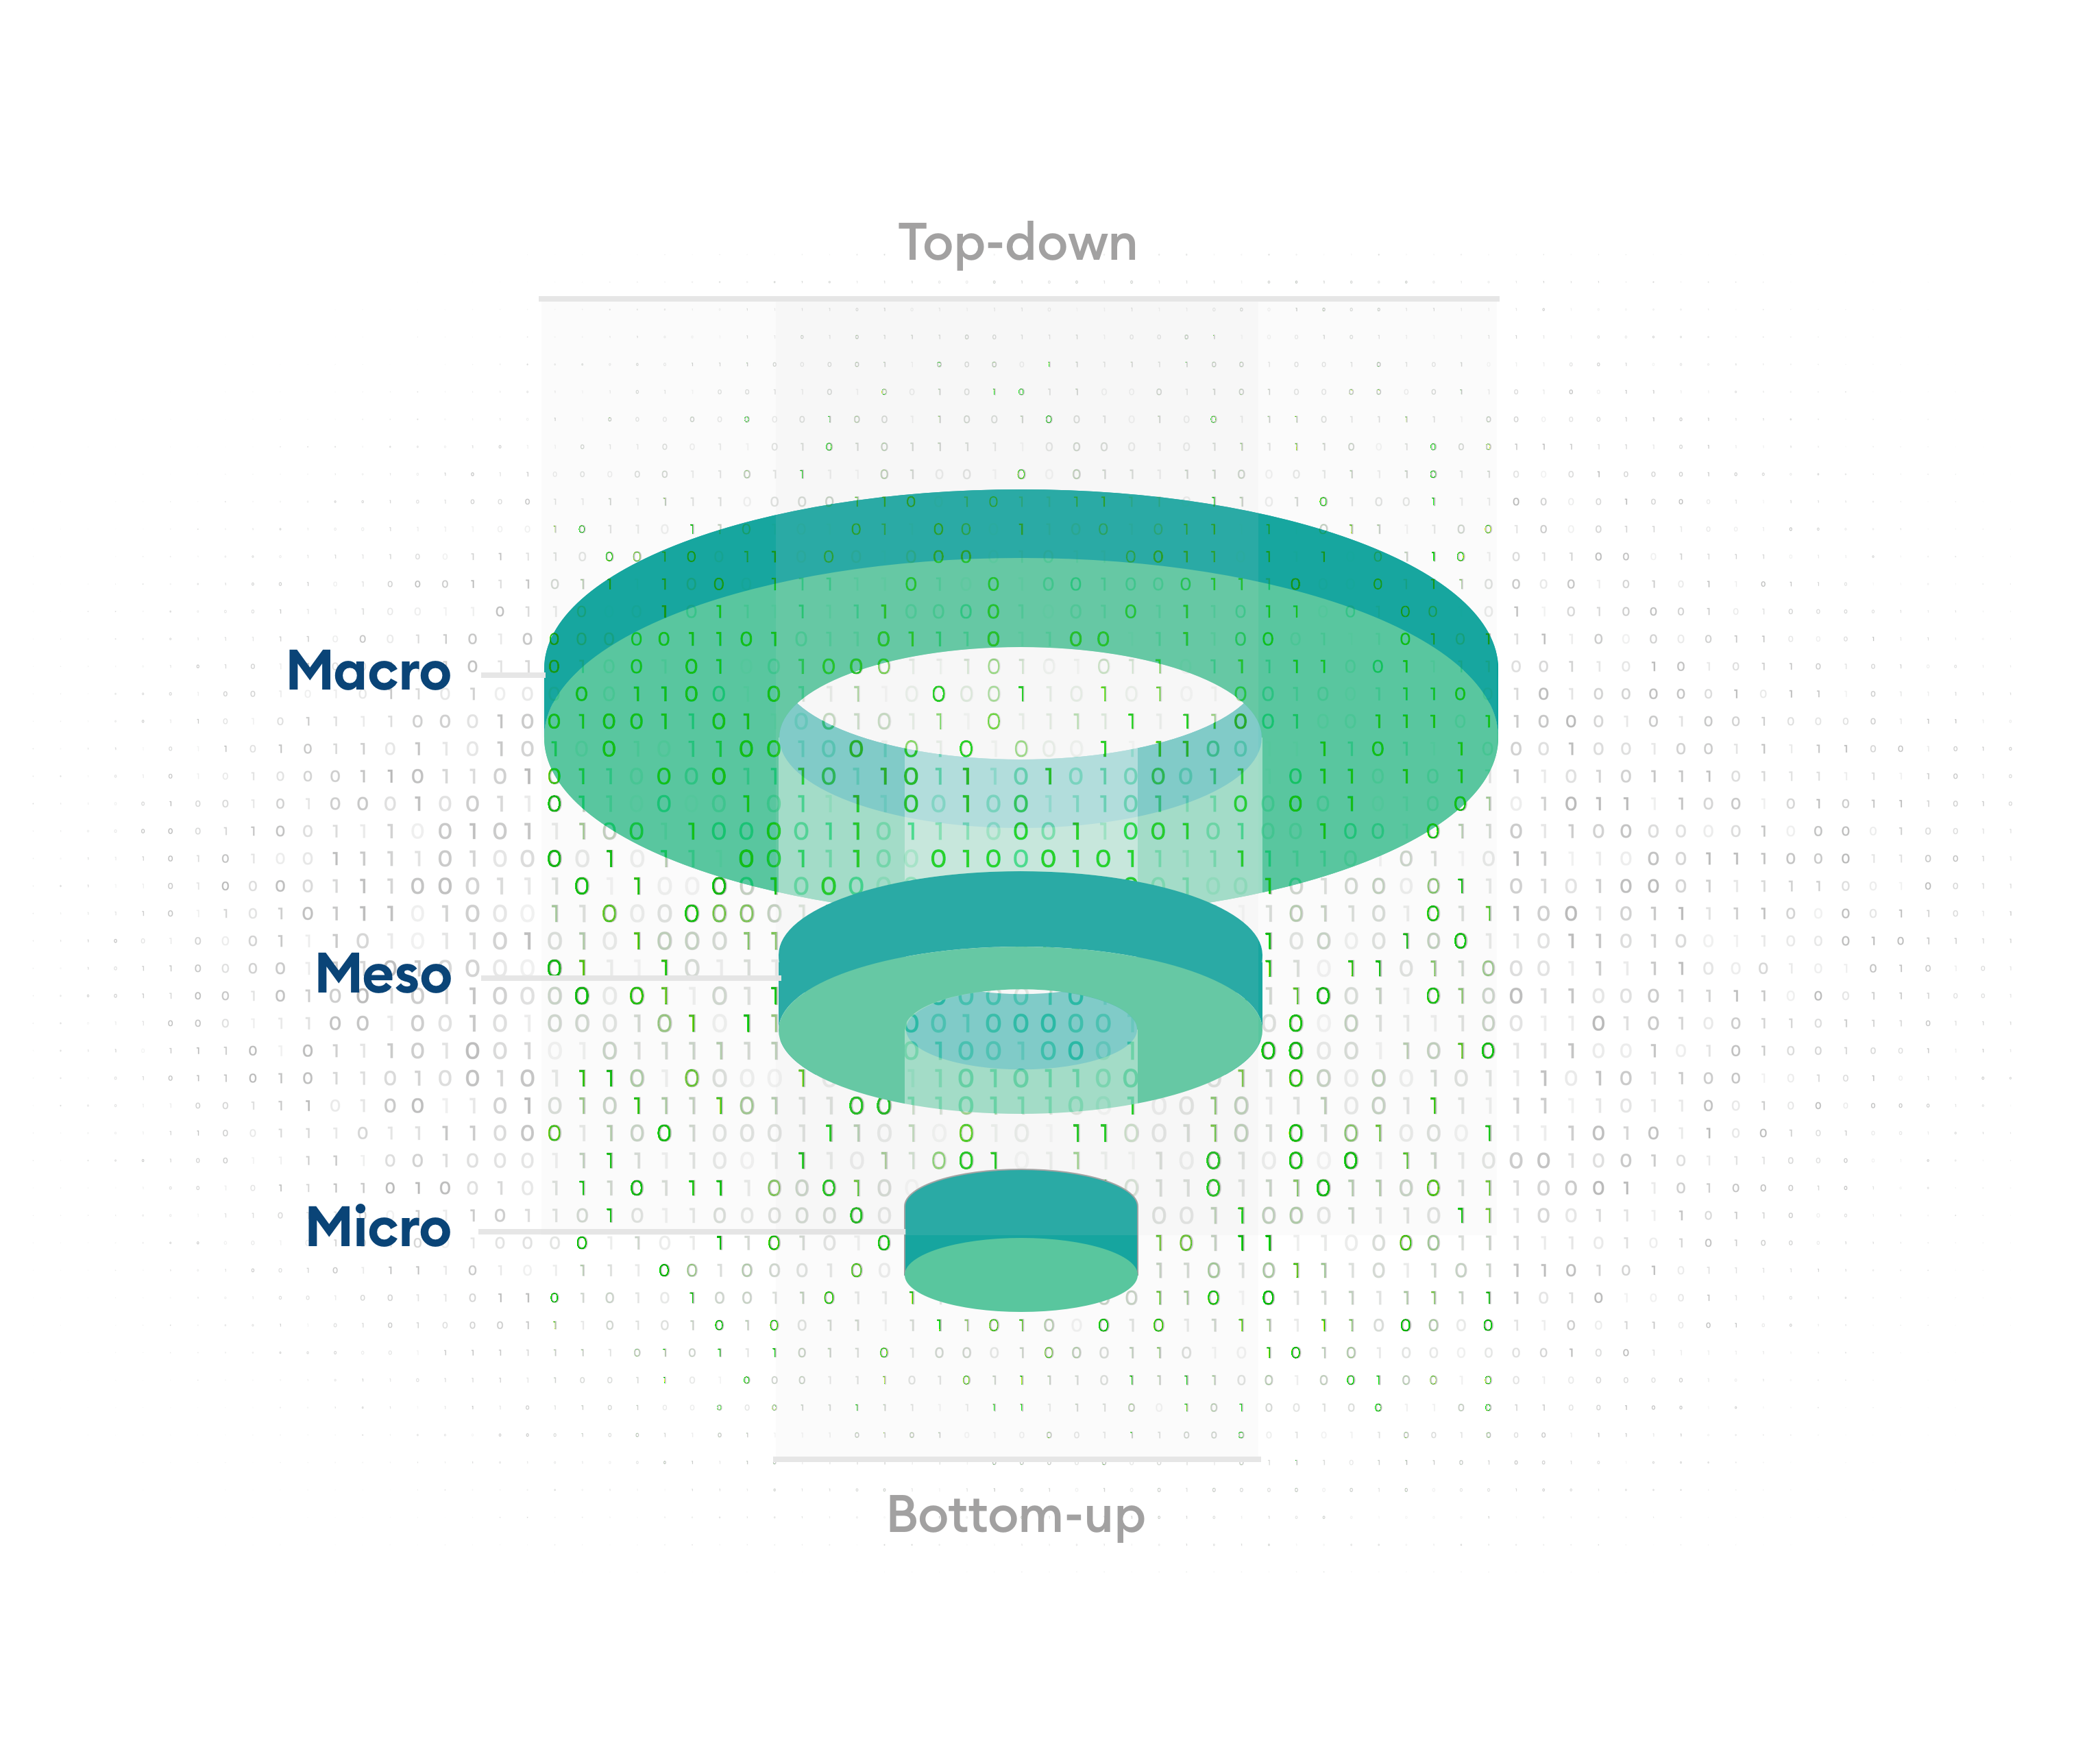
• Activity 3.3: Prepare a functional framework by aggregating final demand into common consumption groups to provide a crucial link between micro and macro systems, essential to informing a holistic understanding of urban metabolism. Together with sector-based categorisation, this framework can support the identification of hotspots, and potential demand-side solutions towards enhanced circularity.
• Activity 3.4: Develop an indicator framework based on local context and data availability to enable footprint baseline assessment, hotspot analysis, and the monitoring of changes over time. • Activity 3.5: Conduct two case studies, selected from regional and metropolitan LGAs, to validate the research methods further and provide greater insights within the context of local decision-making at the municipal scale. A human-centred design process will help ensure that this applied research is valuable to local actors in practice. Tentatively, the selected LGAs are Bunbury (regional) and the City of Cockburn (metropolitan). • Activity 3.6: Visualise the resulting city material footprints and associated environmental impacts geospatially to facilitate a shared understanding of the quantities of material handling and use and enabling the identification of demand-side solutions at the city scale. • Activity 3.7: Stakeholder presentation – materials footprint
Mapping stocks and flows
Building on the material footprint measures of task 3, which measure the overall (supply-chain inclusive) material demands, task 4 will prepare localised stock and flow accounts of actual material and energy use, providing a highlevel overview and understanding of the socioeconomic metabolism of Greater Perth, and the wider Western Australian economy. This task comprises the following activities:
- Activity 4.1: Integrate data on facilities, point sources and industrial supply chains within WA, obtained from State government agencies, utilities, and industry partners.
- Activity 4.2: Prepare localised stock and flow accounts, utilising bottom-up (LCA) and top-down (EE-IO) approaches. A down-scaling method will be used to couple available EE-IO databases with bottom-up data on materials and investments where available, using regionally specific material and emission factors where appropriate. These approaches help to estimate the core direct physical input and output data used in Material Flow Accounting (MFA).
- Activity 4.3: Expand indicator framework based on local context and data availability with a focus on material stocks related to the built environment.
- Activity 4.4: Visualise results using static Sankey diagrams.
- Activity 4.5: Stakeholder presentation – mapping stocks and flows.
Reporting, recommendations and dissemination
![]()
Finally, the research team will assess policy implications and make recommendations for enhanced circularity within the context of Western Australia Net Zero pathways within a final report. The report will summarise key insights derived from each phase of the project, highlight findings from the respective case studies, and provide supporting evidence for future investment and policy development.
- Activity 5.1: Assess the significance of the findings, identify the strengths and limitations of the approach and determine the value and relevance to different levels of government policy (local/regional/state) and to broader industry opportunity, necessary to obtain support for future stages.
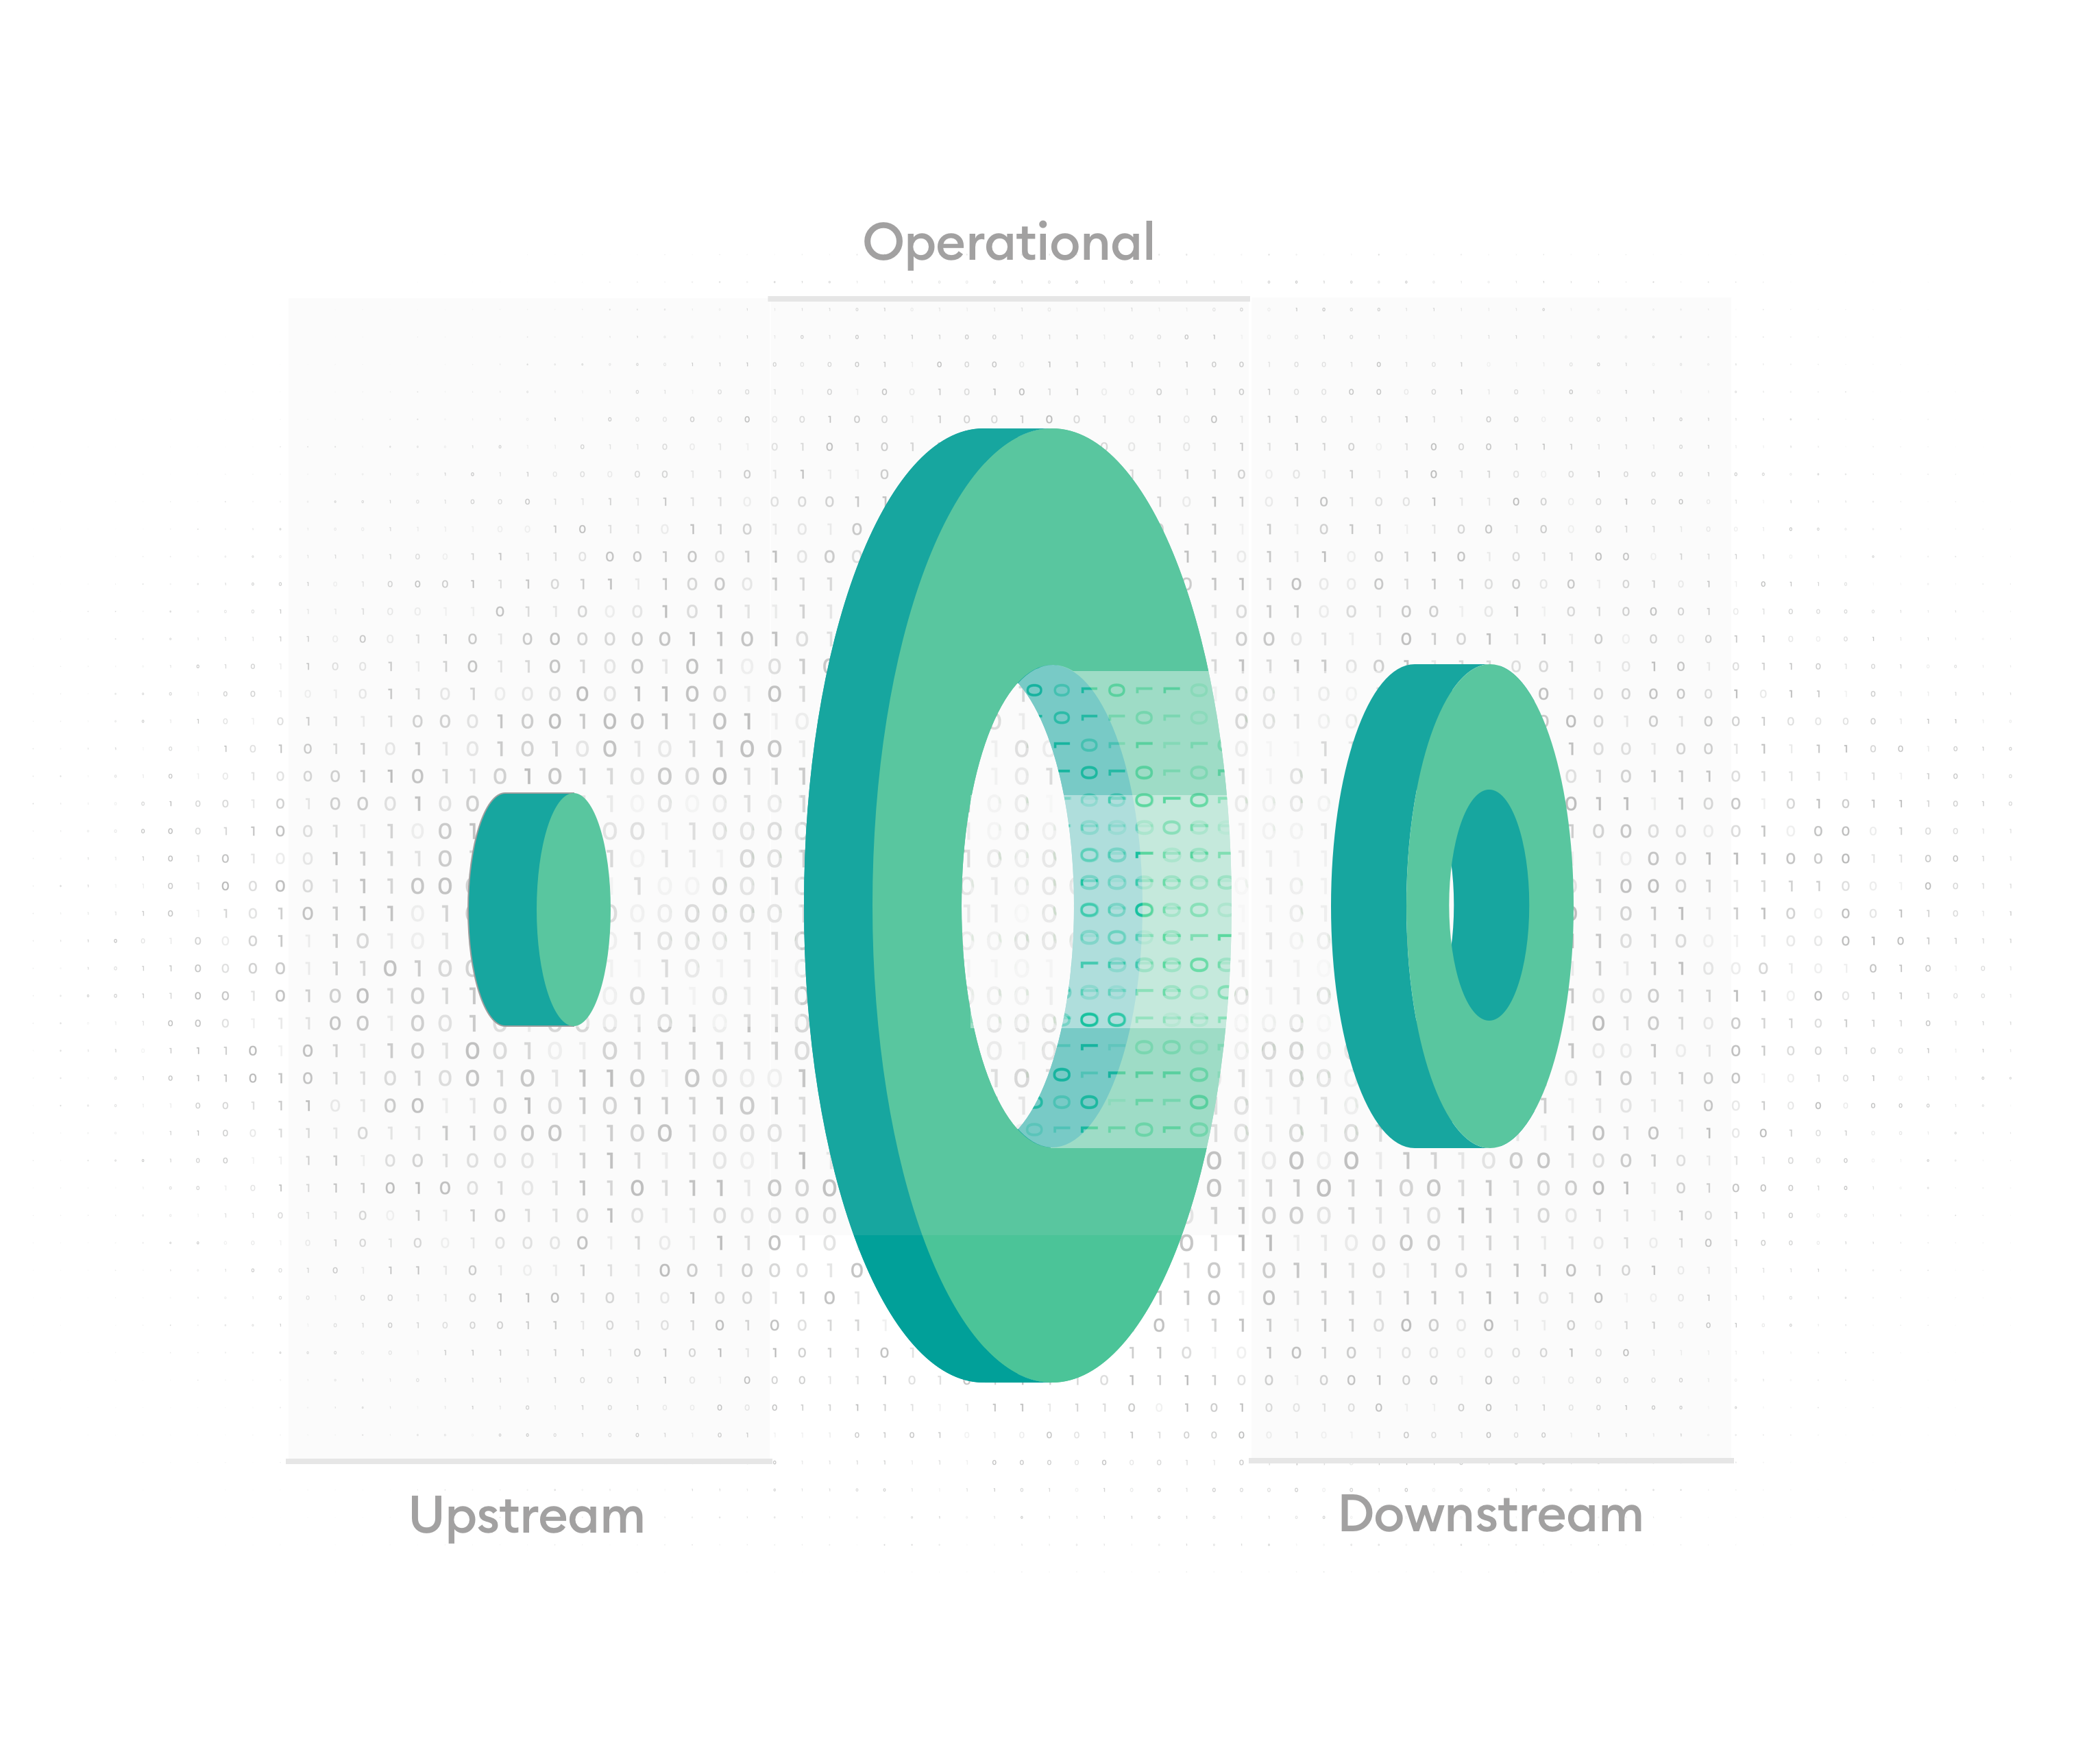
- Activity 5.2: Propose actionable steps for future research that build on Stage 1 outputs, potentially related to additional case studies, adjustments to data collection techniques, database improvements (i.e., regionalisation of IO/SUTs), spatialisation of upstream and downstream impacts, further indicator development, cross-sector and cross-agency integration, decision support tools (e.g., government procurement), dynamic modelling and visualisation tools. Recommendations will be included in the draft report for comments.
- Activity 5.3: Prepare and circulate Draft Report for comments and incorporate feedback into Final Report
- Activity 5.4: Presentations to stakeholders
- Present project achievements at a wider stakeholder seminar/workshop, including results, impact and recommendations for next stages.
- Present to targeted audience of potential supporters of future stages.
Outcome
- Position Western Australia as a global leader in integrating circular economic and Net Zero approaches.
- Valuable insights for policy-makers, industry and community groups.
- Increased awareness and capacity across industry and the greater community, accelerating multi-stakeholder efforts towards a low-carbon, resource-efficient economy.
- Conceptual and empirical backbone to support effective circular planning and decision-making.
- Strong foundation for future research and development (e.g., additional sustainability indicators, circular procurement tools, material exchanges).
Footnotes
Zaman and Lehmann, 2013↩︎
United Nations and the International Resource Panel, 2019↩︎
Government of Western Australia - Waste Authority, 2016↩︎
United Nations and the International Resource Panel, 2019↩︎
Schandl et al., 2020↩︎
Harris et al., 2021↩︎
Lieder and Rashid, 2016; 8. Pauliuk, 2018↩︎
IRP, 2019↩︎
IRP, 2019↩︎
Schandl et al., 2021↩︎
Ma et al., 2022↩︎
Kirchherr et al., 2017↩︎
Wiedenhofer et al., 2021↩︎